National Aeronautics and Space Administration
Goddard Space Flight Center

Space Weather Action Center
Storm Signals
Tutorial: RHESSI Light Curves
The RHESSI satellite uses an instrument that measures high-energy X-ray and gamma-ray emissions over a wide range of energies. You can use the RHESSI Browser to look at so-called "light curves" to identify solar flares. A 'light curve' is a graph that plots the apparent brightness versus time. The RHESSI light-curve data are near-real-time with a processing delay of only a few hours.
The RHESSI Browser is used by scientists all around the world to quickly inspect the latest RHESSI data to look for solar flares, as well as look at any data throughout RHESSI's lifetime. This page is also invaluable for comparing RHESSI observations with other instruments.
Navigation
Above: the RHESSI Images date chooser
The RHESSI browser opens at an automatically selected time, which may not correspond to the most recent data available. If you are looking for data from a particular time (in Universal Time, or UT), you can:
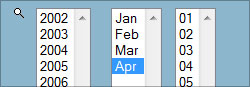
- Select the appropriate year
- Select the appropriate month (some months are not listed if there are no RHESSI data)
- Select the appropriate day (some days are not listed if there are no RHESSI data)
Above: the RHESSI Light Curves date chooser
- Click on the 24-hour time bar to pick the appropriate time-of-day
Above: the RHESSI Light Curves arrow buttons navigation
Otherwise, you can browse through the data using the arrow buttons outlined in red:
- The arrows marked "Day" will step forward or backward by one day at a time
- The arrows marked "Orbit" will step forward or backward by one nominal RHESSI orbit period (~96 minutes) at a time
- The arrows marked "Flare" will step forward or backward through automatically identified events, which are not always flares
Example
- Select "2002" for the year
- Select "Jul" for the month
- Select "23" for the day
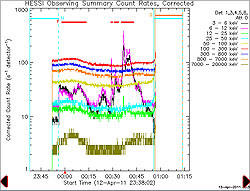
Above: RHESSI Light Curves separated into nine different energy bands
Interpretation
The light curves show the rates of X-ray or gamma-ray photons arriving at the instrument, separated into nine different energy bands. The typical solar flare will appear as sudden increases in the two to three lowest-energy light curves (black curve for 3-6 keV, magenta curve for 6-12 keV, and green curve for 12-25 keV), while the larger flares will show increases in higher-energy light curves as well. The red horizontal bar (labeled with an "F") denotes when an automatic algorithm has identified a flare.
There are time periods when RHESSI is unable to observe solar flares:
- The cyan horizontal bar (labeled with an "N") denotes when the spacecraft is in Earth's shadow and cannot see the Sun. Unlike some other spacecraft that can continually observe the Sun, RHESSI spends ~40% of its orbit in "night". RHESSI sometimes records data during these time periods for other reasons.
- The orange horizontal bar (labeled with an "S") denotes when the spacecraft is passing through the South Atlantic Anomaly. The high doses of radiation in this region prevent the instrument from collecting any usable data.
Here is a more detailed, technical explanation of these plots.
You are viewing a tutorial
Related Tutorials
The above tutorials compliment the downloadable Flip Charts and Data Sheets.