National Aeronautics and Space Administration
Goddard Space Flight Center

Space Weather Action Center
Getting Started
Step 1: Download the Materials
Download the student Flip Charts and Data Collection Sheets from the Downloadable Materials page. Each Flip Chart offers 'Step by Step' instructions on how to quickly retrieve and transfer data to specified Data Collection Sheets. We have divided all of the Space Weather Action Center resources into four 'color-coded' categories: Sunspot Regions (orange), Storm Signals (green), Magnetosphere (blue) and Aurora (purple). The same color code scheme is used in the flipchart, the data collection sheets and on the Live Data and Tutorials webpage. You can always know which section you're in with one quick glance!
For those educators wishing to incorporate SWAC as a classroom learning experience, we have also provided an Instructional Guide and a Flip chart Guide.
NOTE: For those users who are only interested in monitoring space weather data without building a SWAC, simply skip to Step 5.
Step 2: Assemble the SWAC Learning Center
Each SWAC contains the following elements:
- Computer (Internet Access Required)
- Instructional Flip Charts (Assembly Required)
- Data Collection Clipboards or Notebooks (Assembly Required)
- SWAC Display Board or Bulletin Board (Assembly Required)
Students are encouraged to design their action centers with readily available art supplies and downloadable NASA imagery. This artistic approach instills a sense of student ownership and establishes NASA as a visual point of interest in the classroom environment.
Step 3: Record and Analyze Current Space Weather Data
Use the introductory steps provided in the Flip Charts to quickly access and retrieve space weather data. Each Flip Chart is directly linked to specific Data Collection Sheets that will allow you to quickly record and analyze the necessary sets of data. You will find that the data collection sheets follow the same sequence and color coding as the flip charts: Sunspot Regions (orange), Storm Signals (green), Magnetosphere (Blue), Auroras (Purple).
Step 4: Make a Space Weather Action Center Report

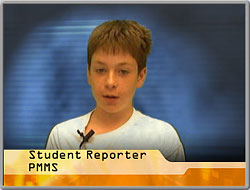
Once you have created your SWAC your class will be ready to move into the second cross-disciplinary phase of the program: creating real SWAC news reports! We've made this phase easy by providing your students with a sample script! All they have to do is fill in the missing pieces based on the data collected in their student journals.
Now it's lights, camera, action! You are finally ready to turn your script into a multimedia broadcast complete with current NASA data and dazzling graphics! If your school isn't equipped with a broadcasting studio, don't worry! We've suggested several very inexpensive methods by which you and your class can produce professional looking Space Weather Action Reports.
Step 5: Continue to Monitor Space Weather Data!
The SWAC website is an extremely robust "one stop shopping' learning tool complete with step-by-step tutorials on how to interpret live or 'near real time' space weather data from 10 missions and 36 instruments. All of the data links required to make your space weather observations are located on a single webpage called Space Weather Data. Beside each of the 'live data' links you will also find 'tutorial' links containing easy to read tutorials that that will help you when interpreting the data. You can always find your place by returning to this page!
