National Aeronautics and Space Administration
Goddard Space Flight Center

Space Weather Action Center
Storm Signals
Radio JOVE Archives Tutorial:
About the Data:
Often you will want to look at graphs of solar events that have occurred during previous days or months. Radio JOVE provides an easy to use archive. The archive also provides the most current data from students who monitor their own radio receivers daily in order to analyze radio signals from the Sun and Jupiter. Each day they upload their data to the archive to compare with other sites that monitored either the Sun or Jupiter. When there is a radio signal from the sun you will see and increase of sun images on the calendar. Once you click on a date you will see data and graphs from the Radio JOVE sites.
Getting the Data:
When you visit the Radio JOVE Archive, you will see the Radio JOVE calendar below:
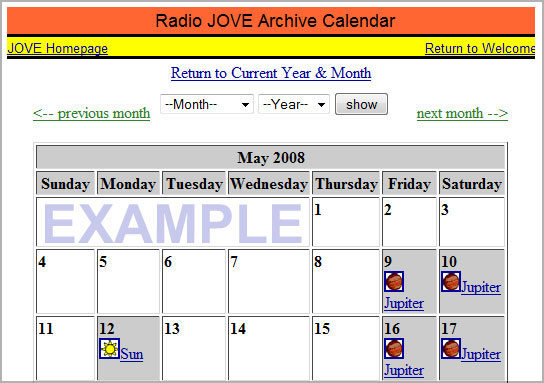
THE IMAGE ABOVE IS NOT LIVE DATA.
You can set the month and year as early as October of 1999 using the 'pull down" menus. The Sun icons on the calendar indicate that someone saved data of solar activity on that day. If you click on a day of solar activity, you will see a page of saved events.
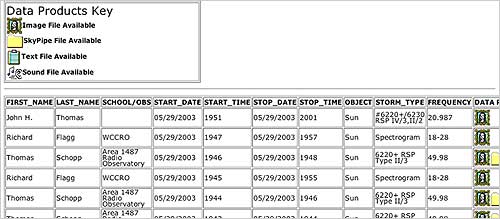
THE IMAGE ABOVE IS NOT LIVE DATA.
Storm Type III usually indicates a solar flare, and a Strom Type II or IV usually indicate a CME. On May 29, 2003 (above) there were several records of such storms. The icons are defined in the upper part of the page. A sample graph from the Image File is shown below.
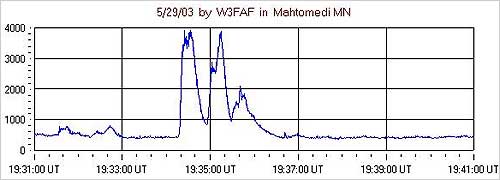
THE IMAGE ABOVE IS NOT LIVE DATA.
As you can see from this sample image, there are three notable events from 19:34 to 19:36 UT. The rise in radio signal is much higher than background noise (the minor 'jitter' that you can see from 19:37 to the end).
Navigation Tip:
- An Image File can be viewed without downloading SkyPipe software. (If you have loaded SkyPipe on your computer, which is not available for Mac computers unless you have virtual PC software, you can also get SkyPipe graphs. Downloading the Sky Pipe software is recommended for students who are interested in using the advanced level for radio waves.)
- Some graphs show very sharp spikes that last only a second or so. These sharp spikes are from interference - sometimes lightening. You may want to print some of the graphs and listen to the corresponding sound frequency , noting the rise in the sound and the spikes on the graph. This will provide visual and auditory verification of a storm leaving the sun. As a reminder, this is the first indicator that a solar storm is headed toward Earth. You now have 3 days to monitor the storm's progress.
You are viewing a tutorial
Related Tutorials
The above tutorials compliment the downloadable Flip Charts and Data Sheets.