National Aeronautics and Space Administration
Goddard Space Flight Center

Sun-Earth Day 2009: Our Sun Yours to Discover
Issue #66: The Chemistry of Stars
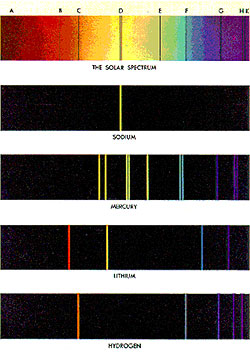
Figure 1: A portion of the spectrum of the sun showing the many dark spectral lines caused by the absorption of light at specific wavelengths from a nun ber of different atoms in the solar atmosphere. For example, 'D' = sodium and 'H' and 'K' are from calcium. (Courtesy: David M. Harrison: http://www.upscale.utoronto.ca/)
It was once said that we would never know what stars are made of...but 150 years ago, the spectroscope changed this idea over night. Prior to the invention of the spectroscope in the 19th Century, it was firmly believed that no one would ever know what stars were made from. Was it some ephemeral celestial Fifth Essence, or something more common. The spectroscope changed this conception literally over-night as individual elements, heated to high temperatures, revealed themselves to be atomic beacons of light; each emitting its own fingerprint pattern of light. These 'spectral lines' as they came to be called, were soon cataloged for all of the common elements that could be brought into the laboratory and heated to incandescence. The sun, stars, planets and distant nebulae also revealed their own patterns of spectral lines (see Figure 1), which allowed astronomers to decipher their composition, and without having to travel light years to scoop out a piece of this star-stuff!
The advent of spectroscopy was followed, between 1920-1930, by the development of rigorous and detailed mathematical models of how atoms 'work': a branch of physics called quantum mechanics. Entirely new techniques for examining spectral lines were quickly developed by astronomers. Now it was possible to measure the speed of motion of distant gas clouds, their densities, whether they were laced by magnetic fields, and precise methods for determining the exact elemental composition of stars. In time, the spectra of stars, and their changes in time, led to the modern techniques for detecting planets orbiting distant stars. By measuring the Doppler shifts of the spectral lines down to meter-per-second accuracy, over 300 planets have been detected in just over 10 years (Figure 2).
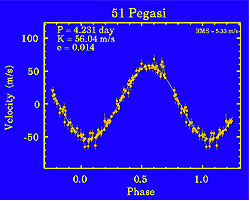
Figure 2: The Doppler Shifts of hundreds of spectral lines, when averaged together, allow astronomers to measure the speed of a star to meter-per-second accuracy. At these levels, the motion of unseen planets can easily be detected, as shown in this 'velocity curve' of the star 51 Pegasi located 50 light years from Earth. The 4.2-day period and 56 meter/sec amplitude of the star's speed change belies an unseen 'exoplanet' about half the mass of Jupiter in orbit around the star. (Courtesy: Geoff Marcy and Paul Butler, SFU/Lick Observatory)
Recently, the Hinode solar observatory, with its Extreme Ultraviolet Imaging Spectrometer (EIS) obtained a spectrum of the sun's hot coronal gases, and among the hundreds of spectral lines (Figure 3) uncovered two new ions that had not been previously found in the sun: Oxygen-VI and Chromium-VII. The EIS is the first high-resolution spectrometer ever to have been flown into space to study the sun. So far, it has detected over 100 spectral lines of which only 50% have been identified as known lines of elements such as iron and silicon.
Hinode uses the wavelength location of the detected solar lines and the Doppler Shift, to study the movement of hot gases in solar flares, solar prominences and other phenomena on the sun. It also uses the shapes of these lines to determine the density and turbulence within the coronal gases. Figure 4 shows one such sequence of images that reveal the different temperatures in various locations within a sunspot region.
Solar satellite observatories such as ESA/NASA's Solar and Heliospheric Observatory (SOHO) have been studying the sun for over 10 years, and have created images of the entire solar surface using spectroscopic techniques. Figure 5 shows a recent full-sun image created by the Extreme-ultraviolet Imaging Telescope (EIT) taken during sunspot-minimum conditions in 2008. By isolating the light produced at a wavelength of 195 Angstroms (19.5 nanometers) by the ion Fe XII. Figure 6 shows the sun during sunspot-maximum conditions in 2001. By using the techniques of imaging spectroscopy, solar physicists can isolate gases heated to temperatures of 1,500,000 K and study their motions and evolution over time.
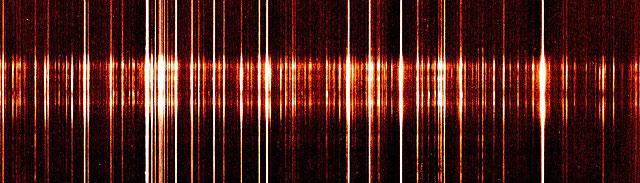
Figure 3: This Hinode/EIS spectrum was obtained between wavelengths of 240-290 Angstroms (24 to 29 nanometers), and shows numerous lines contributed by ions such as iron for which 14 electrons have been removed (FeXV) due to the high-temperature atomic collisions. (Courtesy George Doschek, Hinode/EIS and NRL)
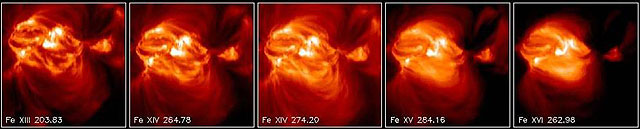
Figure 4: This image was obtained by the Hinode/EIS instrument and shows a solar active region as seen in the light from the ions (Left to right) Fe VIII(203 A), Fe XIV(265 A), Fe XIV(274 A), Fe XV(284 A) and Fe XVI (263 A). These ionic lines can be used as thermometers to locate and map gases heated to temperatures from 200,000 K to 5.6 million K as shown in the image. (Courtesy George Doschek, Hinode/EIS and NRL)
The Sun-Earth Connection
The sun and stars are made from virtually the same elements. This discovery, in the 19th Century, transformed how we thought about the sun as 'just' our closest star in the universe. It also led to methods for studying starlight which led to new discoveries about our sun and the distant stars. To view the sun revealed by spectroscopic techniques, visit the Space Weather Media Viewer at http://sunearthday.nasa.gov/spaceweather/FlexApp/bin-debug/index.html to see the sun through various spectral filters from x-ray to visible light.
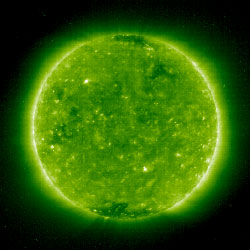
Figure 5: This image of the sun taken on December 16, 2008 during sunspot-minimum conditions, was created by isolating the light produced at a wavelength of 195 Angstroms (19.5 nanometers) by the ion Fe XII. By selecting the light from only one spectral line, a spectroheliograph works like a high-precision light filter and lets astronomers map, or image, a distant object in the light from a single spectral line. This information can be used to map the temperature and density changes in the gas. (Courtesy SOHO/EIT)
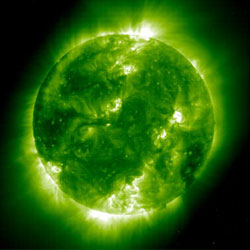
Figure 6: This image of the sun taken in 2001 during sunspot-maximum conditions. Notice the concentration of the hot coronal gases to regions near numerous sunspots. This is very unlike the much smoother distribution oif these gases during sunspot minimum shown in Figure 5. (Courtesy SOHO/EIT)
Space Math Connection:
These problems are available at Space Math @ NASA (http://spacemath.gsfc.nasa.gov)
Hinode Solar Math - http://spacemath.gsfc.nasa.gov/SMBooks/HinodeMath1.pdf
Find the Mystery Lines...if you can: Students use a spectrum from the EIS instrument, and determine the wavelength scale of the figure, to identify new spectral lines and their wavelengths. (Skills: metric measurement; dividing decimals)
Using the Doppler Shift to Study Gas Motion: By using the wavelength shift of the spectral line from an iron atom, students calculate the velocity of a gas cloud on the sun using Hinode data. (Skills: Graph interpolation; dividing decimals; substituting numbers into variables; Algebra 1)
Spectroscopy and Gas Density: The intensity ratio of two iron lines in the solar corona is used to determine the density of the emitting gas. (Skills: graph interpolation; dividing decimals; substituting numbers into variables; Algebra 1)
Density Structure of an Active Region: Students learn about the density of gases near sunspots and other active solar regions using data from Hinode. (Skills: Graph analysis; Scientific Notation; correlating graphical data with an image)
Spectral Line Scaling: Students identify lines in the spectrum of hydrogen by measuring a spectrum and determining the wavelength scale. (Skills: metric measurement; dividing decimals)
The Doppler Shift: Students use the Doppler-shifted spectrum of hydrogen in an interstellar cloud to determine the speed of the cloud and its direction away or towards Earth. (Skills: Metric measurement; calculating a scale; decimal division; substituting numerical values in an equation)
References:
SED-2007 - Solar Science:
- TTT 48 - The Sun from Cradle to Grave
- TTT 49 - Solar Energy
- TTT 50 - Ancient Sunlight
- TTT 52/6 - Solar activity and features
- TTT 57 - The Heliosphere
SED-2008 - Space Weather Around the World:
- TTT 58 - Why is the sun's corona hot?
- TTT 59 - Where did all the neutrinos go?
- TTT 60 - Where does the sun's magnetic field come from?
Credits:
Dr. Sten Odenwald (Author - Hinode)
2009 ISSUES
View past issues
NASA Fact
Between May 10-12, 1999, the solar wind nearly vanished, causing Earth's magnetosphere to expand in volume by over 100 times!