National Aeronautics and Space Administration
Goddard Space Flight Center

Sun-Earth Day 2009: Our Sun Yours to Discover
Issue #65: Surface Temperature and Spectral Class
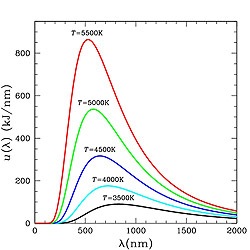
Figure 1: Planck curves for a selection of star temperatures. Yellow stars (like sun) have T=5500 K while red stars like Antares have T=3500K. (Courtesy Wikimedia)
Everyone knows that the sun is hot...but how hot are the distant stars in the sky? The Egyptian Pharaoh Akhenaten (1352-1336 BC) created an entire monotheistic religion based on the warmth of the sun. He was enchanted, not by the golden color of the sun disk, but the emanations of its warm rays, which he saw as innumerable hands reaching out and caressing his face. It would be another thousand years before Ancient Greek philosophers considered the distant stars to be bits of burning coal, or individual deities. Thousands of more years had to pass before modern science regarded the stars, and the sun, as seething balls of plasma heated to millions of degrees in their cores.
The surface of a star is all that we see from earth, and it is the last surface that radiation from its core interacts with before entering the vast, cold darkness of space. Depending on how much energy is flowing through the surface, the surface will be heated to different temperatures. The temperature of the surface also gives it its characteristic color from a cool crimson red, to an intense blue-white.
There is a precise relationship between the temperature of a body and its color, which comes from the fact that a heated surface does not emit the same amount of energy at all possible electromagnetic wavelengths. In fact, the light follows a unique curve deduced by physicist Maxwell Planck. We call it the 'Planck Blackbody Curve' because all bodies, from iron bars, to the distant stars, follow this same curve as the emit light at a specific temperature. Figure 2 shows a few of these curves for different temperatures. Notice that the wavelength of the peak of the curve where most of the light is emitted, shifts from short wavelengths (bluish color) near 500 nm to longer (reddish color) wavelengths near 800 nm as the temperature decreases. This is why a cooling iron bar first appears 'white hot' then changes to yellow to orange to red as it cools.
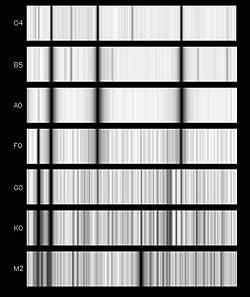
Figure 2: A spectral sequence for stars from hot, O-types to cool M-types. Note the change in the number and intensity of the atomic lines as the star temperature decreases. (Courtesy Helmut Abt, NOAO)
By measuring the exact amount of light produced by a star at specific wavelengths from the ultraviolet to the infrared, astronomers can 'fit' a unique Planck Curve to this data and deduce the star's surface temperature - one of the most fundamental things you can ever hope to learn about a star without actually visiting it!
Another thing that goes along with the temperature of a gas is the pattern of fingerprint lines its constituent atoms produce. As atoms collide, their electrons make jumps from one energy to another in specific steps. Each step downwards in energy causes a photon of light to be emitted. The particular pattern of lines for an element is unique to that element, so astronomers can tell which elements are present in a stars atmosphere by carefully studying these spectral lines. A cool star has elements that produce many of these lines, while a hot star can be so hot that electrons are stripped out of the atoms, thereby reducing the number of lines that can be produced in the atoms (or ions!) fingerprint. By carefully studying the spectra from stars, astronomers can order them from hottest to coolest. Figure 3 shows such a sequence.
Originally astronomers grouped stars into an alphabetical spectral sequence of 26 letters from A to Z, but after careful studies of their spectra, the number of classes was reduced to the series major classes: O, B, A, F, G, K, M.
The Sun-Earth Connection
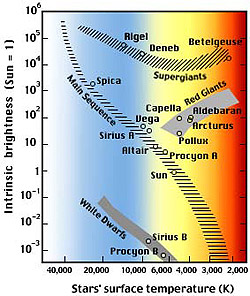
Figure 3: Once a star's temperature is known, and its luminosity is determined from the star's distance, the star it can be plotted on a Hertzsprung-Russel Diagram. This is an important tool for determining how stars evolve. (Courtesy NASA Explores)
The realization that a star like our sun is a heated body took many thousands of years. Eventually its temperature was determined to be 5,770 Kelvins (6,000 C or 11,000 F). Astronomers classify it as a G2 Dwarf Star on the basis of its temperature, power (watts of light) and details of its spectrum.
Space Math Connection:
These problems are available at Space Math @ NASA (http://spacemath.gsfc.nasa.gov)
Predicting the Next Sunspot Cycle [Problem 100]. Students examine a plot of the sunspot cycle and extract information from the plotted data about the previous sunspot cycle. They use this to make predictions about the next sunspot cycle about to start in 2008. [Skills: graph reading; extrapolation; time calculations]
Spectral Classification [Problem 156] Students use actual star spectra to classify them into specific spectral types according to a standard ruberic. [Grade: | Skills: Working with patterns in data; simple sorting logic
Measuring the Temperatures of Stars [Problem 170] Students use a simple formula to determine the temperatures of stars, and to use a template curve to analyze data for a specific star to estimate its temperature. [Grade: 6-8 | Skills: algebra, graph analysis]
Stellar Temperature, Size and Power [Problem 184] Students work with a basic equation to explore the relationship between temperature, surface area and power for a selection of stars. [Grade: 8-10| Skills: Algebra]
Why are things hot? [Problem 191] Students use the Planck Formula to determine the peak wavelength of emission for a given temperature. [Grade: 11-12| Skills: differentiation; finding extrema; graphical solutions for finding the roots of functions.]
References:
SED-2007 - Solar Science:
- TTT 48 - The Sun from Cradle to Grave
- TTT 49 - Solar Energy
- TTT 50 - Ancient Sunlight
- TTT 52/6 - Solar activity and features
- TTT 57 - The Heliosphere
SED-2008 - Space Weather Around the World:
- TTT 58 - Why is the sun's corona hot?
- TTT 59 - Where did all the neutrinos go?
- TTT 60 - Where does the sun's magnetic field come from?
Wikimedia: Planck curves: http://commons.wikimedia.org/wiki/Image:Bbs.jpg
HR Diagram in Figure 3 from NASA Explorers (http://www.nasaexplorer.org/show_912_teacher_st.php?id=050201160919)
Credits:
Dr. Sten Odenwald (Author - Hinode)
2009 ISSUES
View past issues
NASA Fact
During a severe solar storm, Earth loses about 100 tons of its atmosphere into space.