National Aeronautics and Space Administration
Goddard Space Flight Center

Space Weather Action Center
Magnetosphere
Tromso, Norway Tutorial
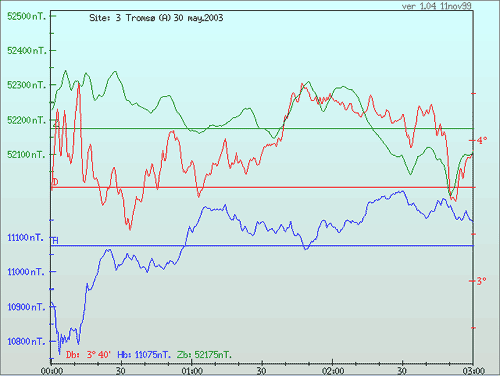
The plots that are produced by Tromso offer information in a slightly different format. These plots are a little more complicated than the Kiruna plot because these scientists elected not to subtract the average Earth field from the data before plotting it. Like the Kiruna Observatory data, the Tromso Geophysical Observatory shows three curves in each plot - but these curves represent different quantities that define the magnetic field. Magnetometer plot from Tromso, Norway data

Above: A Tromso, Norway plot. THIS IMAGE IS NOT LIVE DATA.
The Blue curve is for the horizontal intensity (H). It includes the north-south and east-west values. The Green is for the vertical intensity (Z). The vertical axis on the left shows values for the horizontal magnetic field (blue numbers) and for the vertical magnetic field (green numbers). The horizontal green and blue lines indicate the normal or undisturbed strength of the magnetic fields.
The Red curve gives the value of the angle between the north geographic and north magnetic pole (D). The horizontal red line indicates the normal or undisturbed angle between north geographic and north magnetic pole at this location. The vertical axis on the right is the angle in degrees (red numbers)
It is easy to see just how 'stormy' things are by looking at the curve compared to its horizontal line (i.e. the green curve compared to the green line) . When there is a big difference between the current and average measurements, a magnetic storm is in progress in Tromso. It is also interesting to look at how complicated these magnetic storms can be with all the jumps and wiggles that happen! The sample graph above for the magnetic storm of May 30, 2003 shows that the strength of the horizontal (H) part of the magnetic field changed, the strength of the vertical (Z) part of the field changed and the direction of the horizontal part changed.
When you click on the "Live Data" link for Tromso, you will see four plots like the above from different magnetometers operated by the University of Tromso. These plots are updated every 4 minutes.
You are viewing a tutorial
Related Tutorials
The above tutorials compliment the downloadable Flip Charts and Data Sheets.
