National Aeronautics and Space Administration
Goddard Space Flight Center

Space Weather Action Center
Auroras
NOAA Polar-orbiting Operational Environmental Satellite (POES):
Getting to the Data:
The easiest way to view this image is by opening the Space Weather Media Viewer. In the "IMAGES" section select "Auroras" from the small drop-down menu. Next, select the image called, "Auroral Activity on Earth - NOAA POES". Alternatively, you can view the image directly on the NOAA Aurora 30 minute forcast page
Navigation Tip:
- When using the Space Weather Media Viewer don't forget to zoom in and pan to the top center of the image in order to see the exact date and time of the image.
- The box marked "Details" found in the lower right hand side of the Space Weather Media Viewer screen will provide additional information and a link to the SEC POES Auroral Activity.
About the Data:
This plot provides an estimate of the location, extent, and intensity of the auroral oval in the northern hemisphere. If the red-orange extends down into the northern most states of the United States, you can expect to see auroras in these states. If there is a severe magnetic storm, you could expect to see the red-orange extend into the middle of the United States, and you might see aurora into Texas and Florida.
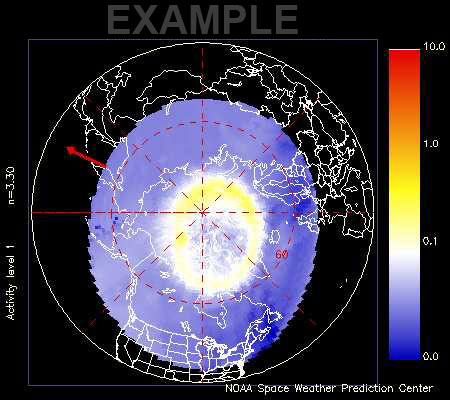
THE ABOVE IMAGE IS NOT LIVE DATA.
This sample image comes from the NOAA Polar-orbiting Operational Environmental Satellite (POES)
Navigation Tips:
- The red arrow in the plot points toward noon
- Red and orange indicate intense auroral activity
- Yellow indicates moderate activity
- Blue indicates low auroral activity
Additional Content:
The size and extent of these 'Auroral Ovals' change constantly during severe magnetic storms as particles from the distant magnetic tail of the Earth slam into the oxygen and nitrogen atoms in Earth's atmosphere. These currents dissipate electrical energy in the upper atmosphere. The NOAA Polar-orbiting Operational Environmental Satellite (POES) can measure how much energy is released. Instruments on board POES continually monitor the power flux carried by the protons and electrons that produce aurora in the atmosphere. A technique was developed that uses the power flux observations obtained during a single pass of the satellite over a polar region (which takes about 25 minutes) to estimate the total power deposited in an entire polar region by these auroral particles.
You are viewing a tutorial
Related Tutorials
The above tutorials compliment the downloadable Flip Charts and Data Sheets.