
Lou Mayo
I often stump people at public talks or when I visit classrooms with the question "How far away is the closest star?". Besides the people who just have no clue, many enlightened responses identify Alpha Centauri at 4.3 light years (about 25,278,035,225,760 or 25.28 trillion miles). When I give them another chance noting that you can't see Alpha Centauri from Northern high latitudes like Washington DC and ask, "OK, how far away is the closest star we can see from the northern hemisphere, I often get blank looks. Of course, when I give them the answer, they accuse me of asking a trick question, and, in a way it is.
The Sun, our very own star, is an amazingly complex and ever changing celestial object. It is a variable star, meaning that it changes in brightness on a regular schedule, emitting radiation across the full range of the electromagnetic spectrum from low energy radio waves that easily penetrate our atmosphere to deadly, high energy x-rays and gamma rays that are thankfully absorbed before they reach the ground. It is most probably, a prima fascia requirement for life - no star to orbit, no elephants or amoebas. At an average distance of just 93 million miles (149 million km) it beats out Alpha Centauri, its nearest competitor by a factor of 272,000 and if it were at the distance of Alpha C, we would get only 1/74,000,000,000 of the solar energy we now enjoy - a pretty chilly proposition!
Where g = number of sunspot groups and f = number of individual sunspots
The sun has some interesting bio-rhythms. The most prominent is the 11 year sunspot cycle. This cycle, first identified by Heinrich Schwabe in 1843 and later refined by Johann Rudolph Wolf in 1847, involves the slow rise and fall of solar activity as reflected in the numbers of sunspots seen on the solar disk (photosphere). The sun is now on the upward side of this cycle, which peaked around 2001. The now famous Wolf Index (OK, only if you are really in to astronomy) developed by Wolf in 1848, is still in use today with minor modifications as a standard method of counting sunspots and thus provides a consistent historical record of solar activity dating back over 150 years. Annual sunspot counts can actually be derived from data dating back to around 1700 and records of sunspot observations have even been traced 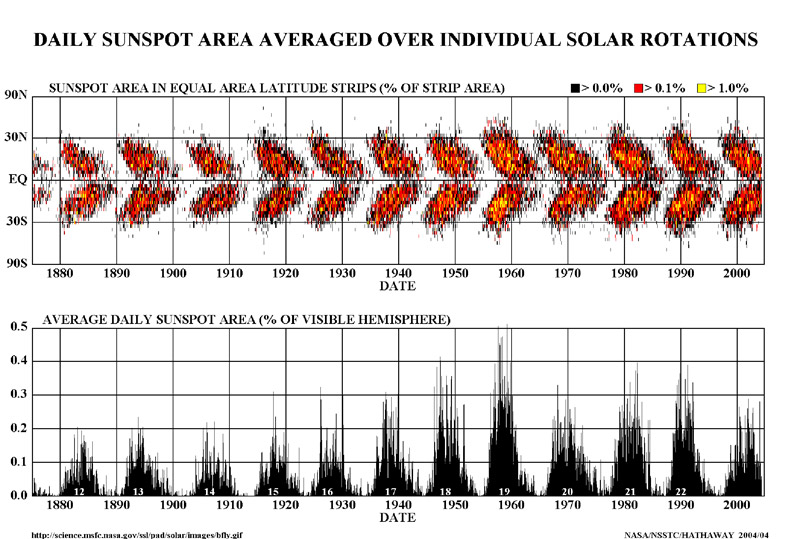 through publications by Chinese astronomers back to 300 A.D. The understanding of this cycle is quite important. Changes in solar activity follow this cycle such that there are considerably more solar storms (flares and Coronal Mass Ejections or CMEs) during periods of high sunspot counts than periods of low sunspot counts. These storms can send a billion tons of electrically charged gas (plasma) rocketing into space with velocities between 500 and 2000 km/sec! When this stuff is aimed at Earth, the resulting geomagnetic disturbances can wreck havoc with satellite electronics, communications systems, and even power grids. In fact, because the Earth and all the planets orbit within the extended atmosphere of the sun, we can feel the impact of powerful events like CMEs as they disturb the solar atmosphere even when they are not aimed directly at us.
Surprisingly, there have been periods of time where almost no sunspots were seen on the sun. These periods called "minima" have been correlated with similar periods of unusually low temperatures on the Earth. Such is the case for the "Maunder Minimum", a period between about 1645 and 1715 where careful observations of the sun by notable astronomers turned up very few sunspots. Similar lulls in sunspot activity occurred between 1795 and 1820 (Dalton Minimum) and from 1450 to 1540 (Sporer Minimum) where similar drops in temperature were observed. In fact, data from 8,000 year old pine trees suggests there have been 18 such minima in the past 7,800 years. Adding to the intrigue, satellite observations of the sun show a slight (~0.1%) drop in solar output during normal 11 year sunspot minima. The connection between sunspot counts and climate variability is still a matter of hot debate - stay tuned!
The movement of sunspots across the sun was the first indication that the sun rotates. You can observe sunspot movement and derive a rotation rate for the sun yourself. Observations should be taken at least every two days since sunspots change shape and even disappear over time scales of days. Once you've observed how long it takes a particular sunspot or sunspot group to move from one limb of the sun to the other, multiply the time it took by two and you will have an estimate of the sun's rotational period. If you can't get out to view the sun yourself, there are a number of fine solar observatory websites that can provide images for you.
So, what can you do about this? Get out and observe your only star! Sunspots are actually fairly easy to view. Most solar projection devices will produce very fine images of sunspots, projecting the sun's light onto a smooth surface for safe viewing. Telescopes can be used to view sunspots too but only when fitted with filters designed specifically for safe solar viewing. Most recently high quality hydrogen alpha (H-alpha) filters have become available for under $1000. These filters allow views of solar prominences that are obscured otherwise by the sun's bright photosphere.