National Aeronautics and Space Administration
Goddard Space Flight Center

Space Weather Action Center
Sunspot Regions
SOHO MDI Magnetogram Tutorial
The SOHO magnetogram images give very different kinds of information. The image below shows the magnetogram (left image) and the MDI (right image) for May 27, 2003.
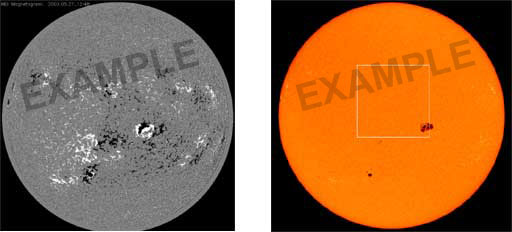
THESE IMAGES ARE NOT LIVE DATA
The MDI magnetogram is not a picture your eye could see. It is a type of plot to show magnetism. The MDI Continuum on the right is much like what your eye could see. The magnetogram image shows the magnetic field in the solar photosphere, with black and white indicating opposite magnetic poles. You are probably familiar with a bar magnet. One end of the bar has a north magnetic pole and the other end has a south magnetic pole. The white areas are regions of north magnetic poles and the black shows regions of south magnetic poles. The gray color shows an absence of magnetic fields. The colors, back, white and gray, are artificial.
The magnetogram can help to predict solar storms. When the black and white areas next to each other are clearly separated, there is less chance of a solar eruption. When black and white areas are mixed together, there is a better chance for a solar eruption from that location. You can find out more about magnetograms from the Stanford Solar Center.
You are viewing a tutorial
Related Tutorials
- H-Alpha Full Disk Image of the Sun
- Atmospheric Imaging Assembly
- Large Angle and Spectrometric Coronagraph
The above tutorials compliment the downloadable Flip Charts and Data Sheets.