National Aeronautics and Space Administration
Goddard Space Flight Center
Space Weather Action Center
Storm Signals
University of Florida Radio Observatory Tutorial:
About the Data
When a solar flare or coronal mass ejection erupts, hot, charged particles are accelerated away from the Sun. When this happens, a radio signal is emitted that reaches Earth in a little over 8 minutes providing the first signal that a solar storm is headed our way. However, the particles from that same storm usually take up to 3 days to reach Earth.
Solar flares and Coronal Mass Ejections (CMEs) emit a broad range of light. Most of this light is invisible to us. To detect solar storms we will use radio waves, x--rays, and ultraviolet light. Radio waves are especially useful because they can be measured by instruments on the Earth and in interplanetary space.
The ground based observatory that is easiest to use is the professional observatory at the University of Florida. The best time to observe is between 10:00 am and 2:00pm ET. Florida also has intense electrical storms during the summer. Also, Florida has intense electric storms during the summer. To protect their equipment, the site is closed from June to late September and also during times of maintenance. During the times that the Florida Radio antennas are not functioning, you can use data from the "Radio JOVE Archive". This archive is easy to use and needs no more than a web browser and computer. You can find a link to the "Radio JOVE Archive" on the Space Weather Resources web page under 'Storm Signals'.
Getting the Data
After you click on the University of Florida in the "Storm Signals" section of the "Space Weather Resources" web page, you will see a page that looks like this.
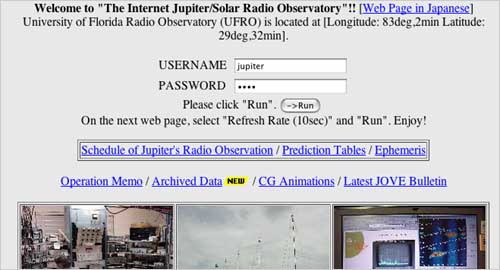
THIS IMAGE IS NOT LIVE DATA
Ignore the Username and password; they have been set for you. Click Run. The next page should look something like this:
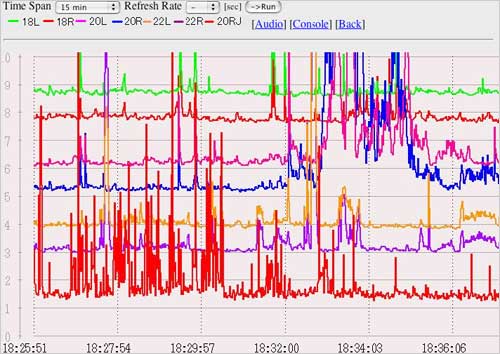
THIS IMAGE IS NOT LIVE DATA
This plot looks pretty complicated because it shows the radio signal from several antennas at once. Each antenna is recording a different radio frequency. It is rather like listening to a radio that is bringing in several stations at once. Please note that the times are in Universal Time (UT) -See the Universal Time conversation table at the bottom of the page.
Across the top of the above image are two 'pull down' menus.
- The first is 'Time Span'. When you click and 'pull down' that menu, you will have 6 options; 15 min, 75 min, 150 min, RJ15 min, RJ75 min, RJ 150 min. The 15, 75 and 150 min allow you to set the horizontal time axis to 15, 75 or 150 min and still show all the signals from all the different antennas. We recommend that you select one of the RJ (for Radio JOVE) settings + again the 15, 75 and 150 indicate how many minutes will be displayed.
- The second menu is the Refresh Rate. It lets you choose how often the graph is updated or 'refreshed'. When you first enter the page the Refresh Rate is off. Set your sec/each field to something compatible to the speed of your network connection. If you have a slow connection (i.e. dialup-modem), then your browser may not keep up with a high refresh rate (3 to 10 seconds), so set this field to a high number between 20 and 40 so that the image is refreshed every 20 or 40 seconds. If you have a fast connection (i.e. cable, DSL, or LAN), you can set this field to a lower number so that it refreshes the image more quickly.
Important: In order to initiate the changes, you must click the 'Run' button after you make changes to the Time Span or Refresh Rate. After you have set the menus as suggested you will see a graph similar to the one below.
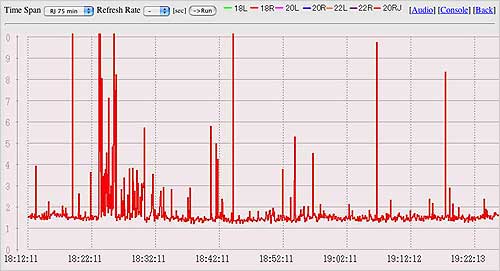
THIS IMAGE IS NOT LIVE DATA
The sharp spikes in the above graph are usually due to man-made signals or lightening strikes. The number of spikes and the weather forecast for Florida on the day this graph was made is consistent with lightening.
A solar storm would show a gradual rise and fall in the signal over several seconds to several minutes. The graph would look somewhat like a shark fin.
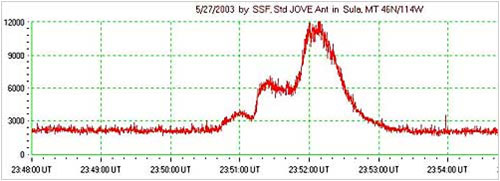
THIS IMAGE IS NOT LIVE DATA
Tips for Additional Research:
Skypipe Software: If you wish to really get involved with observers in the RadioJOVE network, comparing data from several sources at once and having on-line chats with the observers running the stations, you should download the Skypipe software (Windows operating systems only, however, this does include virtual PC platforms on Macs).
Build Your Own RadioJove Kit:
You can detect these radio signals from the sun with a simple antenna, a RadioJove kit, a speaker and a computer. The speaker allows you to hear the radio emission. When little is happening on the Sun, you will hear a quiet hiss. When an emission from a solar storm reaches Earth, the hiss will gradually increase in volume and then slowly decrease. This will take from several seconds to a couple of minutes. The RadioJove website provides an order form and instructions for this activity. Caution: Requires assembly of a circuit board, experienced guidance is recommended.
Converting to Universal Time (UT)
Note: UT is the same as Greenwich Mean Time.
Eastern Standard + 5 hours = UT
Central + 6 hours = UT
Mountain + 7 hours = UT
Pacific + 8 = UT
Alaska Standard Time + 9 = UT
Note: For Daylight Savings Times
Eastern Daylight Savings + 4 hours = UT
Alaska Daylight Savings + 8 hours = UT
You are viewing a tutorial
Related Tutorials
The above tutorials compliment the downloadable Flip Charts and Data Sheets.